Although shares in Truworths International have recovered from their Covid-19 lows, they remain below the peaks achieved in 2013, 2016 and 2018.
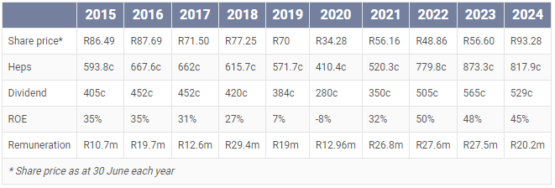
Over the past decade (between 1 July 2015 and 30 June 2024), shares are up just 7%.
Read: Tough year for Truworths
Put another way, its market capitalisation was R36 billion in July 2015. Today, it is R38 billion.
Over the same period, the JSE Top 40 delivered a return of 8.76% per year on average. That represents a total return of well over 100% (130% if compounded).
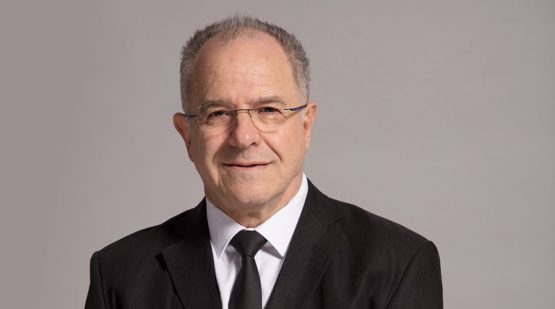
Over that same period, Truworths CEO Michael Mark has been incredibly well remunerated. Across the 10 financial years, he has been paid a total of R206.6 million in guaranteed pay, benefits and short-term incentives.
Importantly, this does not include the value of any long-term incentives awarded. This is a much more accurate representation of remuneration as these awards are typically from a number of years prior, with performance hurdles that trigger the vesting of the options, shares, or restrictive shares.
Over the decade, Mark’s (base) salary has increased by 76% – from R6.4 million to R11.321 million.
He receives a notional amount of allowances or benefits (R62 000 in the most recent year), which cover “subsistence allowances for local and overseas travel, long-service awards and fringe benefits on life insurance premiums paid”. His salary and benefits over the last 10 years don’t get one close to R100 million.
Read: Truworths CEO sells R100m in shares to pay taxman, loans
The bulk of his paid remuneration each year tends to typically be in the form of cash short-term incentives. Last year, this was R7.8 million, while in the 2023 financial year, it was over R13 million.
For FY2023, the group’s short-term incentive targets were across: adjusted headline earnings per share (Heps) growth, adjusted return on assets, adjusted return on equity, and gross margin. These comprise 70% of the weighting. The remaining 30% is for so-called strategic targets.
Performance targets
In FY2023, there were seven elements here. In FY2023, Mark achieved 122% performance under its short-term incentive (STI) scheme “after group and personal performance on-target STI modifiers”.
The exact performance of Mark and other executives for FY2024 will be detailed in the group’s annual report, but we do know they were measured against the same four financial targets. The weighting for Heps growth was reduced, while that for gross margin was increased.
Included in Mark’s remuneration (and that of other executives) is the annual benefit of interest-free loans granted for the group’s 1998 share scheme. Mark has derived a benefit of a few million rands (around R2 million to R3 million) each year in lieu of interest. At the end of June 2023, he had a total of R43 million in loans under this arrangement. The group does, however, note that “all outstanding loans were repaid” by the end of June 2024.
Over the decade, the group has delivered reasonable growth in headline earnings per share.
In FY2015, it reported headline earnings of R2.5 billion, while in FY2024 this was R3 billion – just 23% growth. On a per-share basis, Heps were up 38%.
It has achieved this by steadily using excess capital to buy back shares on the open market and cancel them. In 2015, it had a weighted average of 416 million shares. Last year, it had 371 million – a reduction of 24%.
This has enabled it to boost Heps (just a coincidence, of course, that executives are measured on this metric) as well as the dividend per share. This is up from 405c in FY2015 to 529c in FY2024 (30%), but much of this increase would’ve been delivered by the reduction in shares in issue.
Read:
Remuneration disclosures
Executive pay: The virus Elon Musk is exporting back to SA
Using share price performance alone is not entirely accurate as this doesn’t take into account dividends received over the period.
Over the 10 years, Truworths has paid a total of R43 in gross dividends to shareholders (excluding dividend withholding tax), which is close to half the current share price.
Still, Mark has done a lot better. And this excludes the roughly R100 million in options, shares, and restricted shares that he still holds under various long-term incentive schemes.
At least Truworths shares are up over the 10 years.
Rival TFG Limited has seen its market capitalisation decline from R38 billion to R32 billion (14%).
Thanks to various rights issues (which are dilutionary), TFG’s share price is down 45% – from R180.57 in FY2015 to R99 at the end of FY2024!
Follow Moneyweb’s in-depth finance and business news on WhatsApp here.













COMMENTS 3
You must be signed in to comment.
SIGN IN SUBSCRIBE
or create a free account.
Free users can leave 4 comments per month.
Subscribers can leave unlimited comments via our website and app.
Compared with the rest of the the clothing retail segment the performance of Truworhs with Mr. Mark at the helm more than warrants his remuneration and benefits.
4
5
Another one of “those” executives, the number of stories I read of a similar nature on Moneyweb is atrocious, I might not be a finance/investment guru in any shape or form but if you are measured on the performance of the share price and use excess funds to buy back shares, reducing supply and increasing price (artificially) and then dividing the HEPS of a smaller number of shares to boost that as well, and then ticking all your KPI’s, surely the institutional investors can see through this rubbish. And I still can’t believe share buy backs are not given the roasting they deserve, correct me if I am wrong but a very simple explanation of a share buyback is this, “here mr investor, we don’t want your money cause we dont know what to do with it, so please give us our share back and you can have you money back” that is what a share buyback appears to be in my simple understanding, love to hear a counter argument to this?
2
I hope there is a follow up article on Mr Thunstrom at TFG. The end of the article alludes to it, but I think he has been paid even more than Mr Mark for worse performance.
Load All 3 Comments
End of comments.